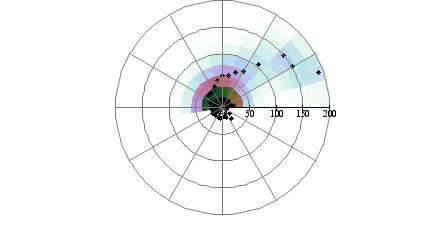
極座標での温度分布_図は、スタイル with surface と set polar grid を合わせて使用することで生成できます。
    set size square
    set angle degrees
    set rtics
    set grid polar
    set palette cubehelix negative gamma 0.8
    set polar grid gauss kdensity scale 35
    set polar grid theta [0:190]
    plot DATA with surface, DATA with points pt 7
竹野茂治@新潟工科大学