![[*]](crossref.png) )。
)。
plot with boxes は、基本的に 2 列、または 3 列のデータを使用します。
さらに入力列を追加すると、それは variable 行や塗り潰し色の情報として使
用します。以下参照: rgbcolor variable (p. )。
    2 列:  x  y
    3 列:  x  y  x_width
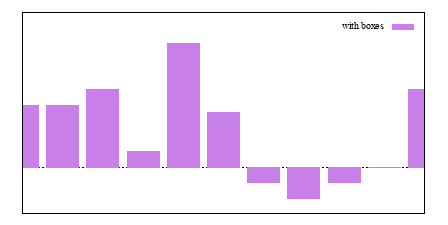
箱の内部は現在の塗りつぶしスタイル (fillstyle) で塗りつぶします。それ
以外に、塗りつぶしスタイルを plot コマンド上で指定することもできます。
以下参照: set style fill (p. )。
塗り潰し色を plot コマンドで指定しなければ、現在の線色を使用します。
例:
データファイルを単色塗りした箱で描画し、箱同士を少し垂直方向にスペース を空ける (棒グラフ):
     set boxwidth 0.9 relative
     set style fill solid 1.0
     plot 'file.dat' with boxes
パターンでの塗りつぶしスタイルの箱で sin と cos のグラフを描画:
     set style fill pattern
     plot sin(x) with boxes, cos(x) with boxes
sin はパターン 0 で、cos はパターン 1 で描画されます。追加される描画は 出力ドライバがサポートするパターンを循環的に使用します。
それぞれのデータ集合で明示的に塗りスタイル、塗り色を指定:
    plot 'file1' with boxes fs solid 0.25 fc 'cyan', \
         'file2' with boxes fs solid 0.50 fc 'blue', \
         'file3' with boxes fs solid 0.75 fc 'magenta', \
         'file4' with boxes fill pattern 1, \
         'file5' with boxes fill empty